Global Trends in Renewable Energy Investment
Global investments in renewable energy skyrocketed in 2014, recording a 17% rise to $270 Billion after two years of declines according to UNEP report 2015.
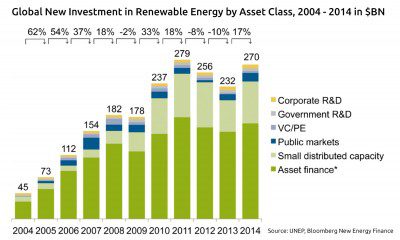 Major expansions of solar installations in China and Japan and record investments in offshore wind projects were responsible for the strong increase.
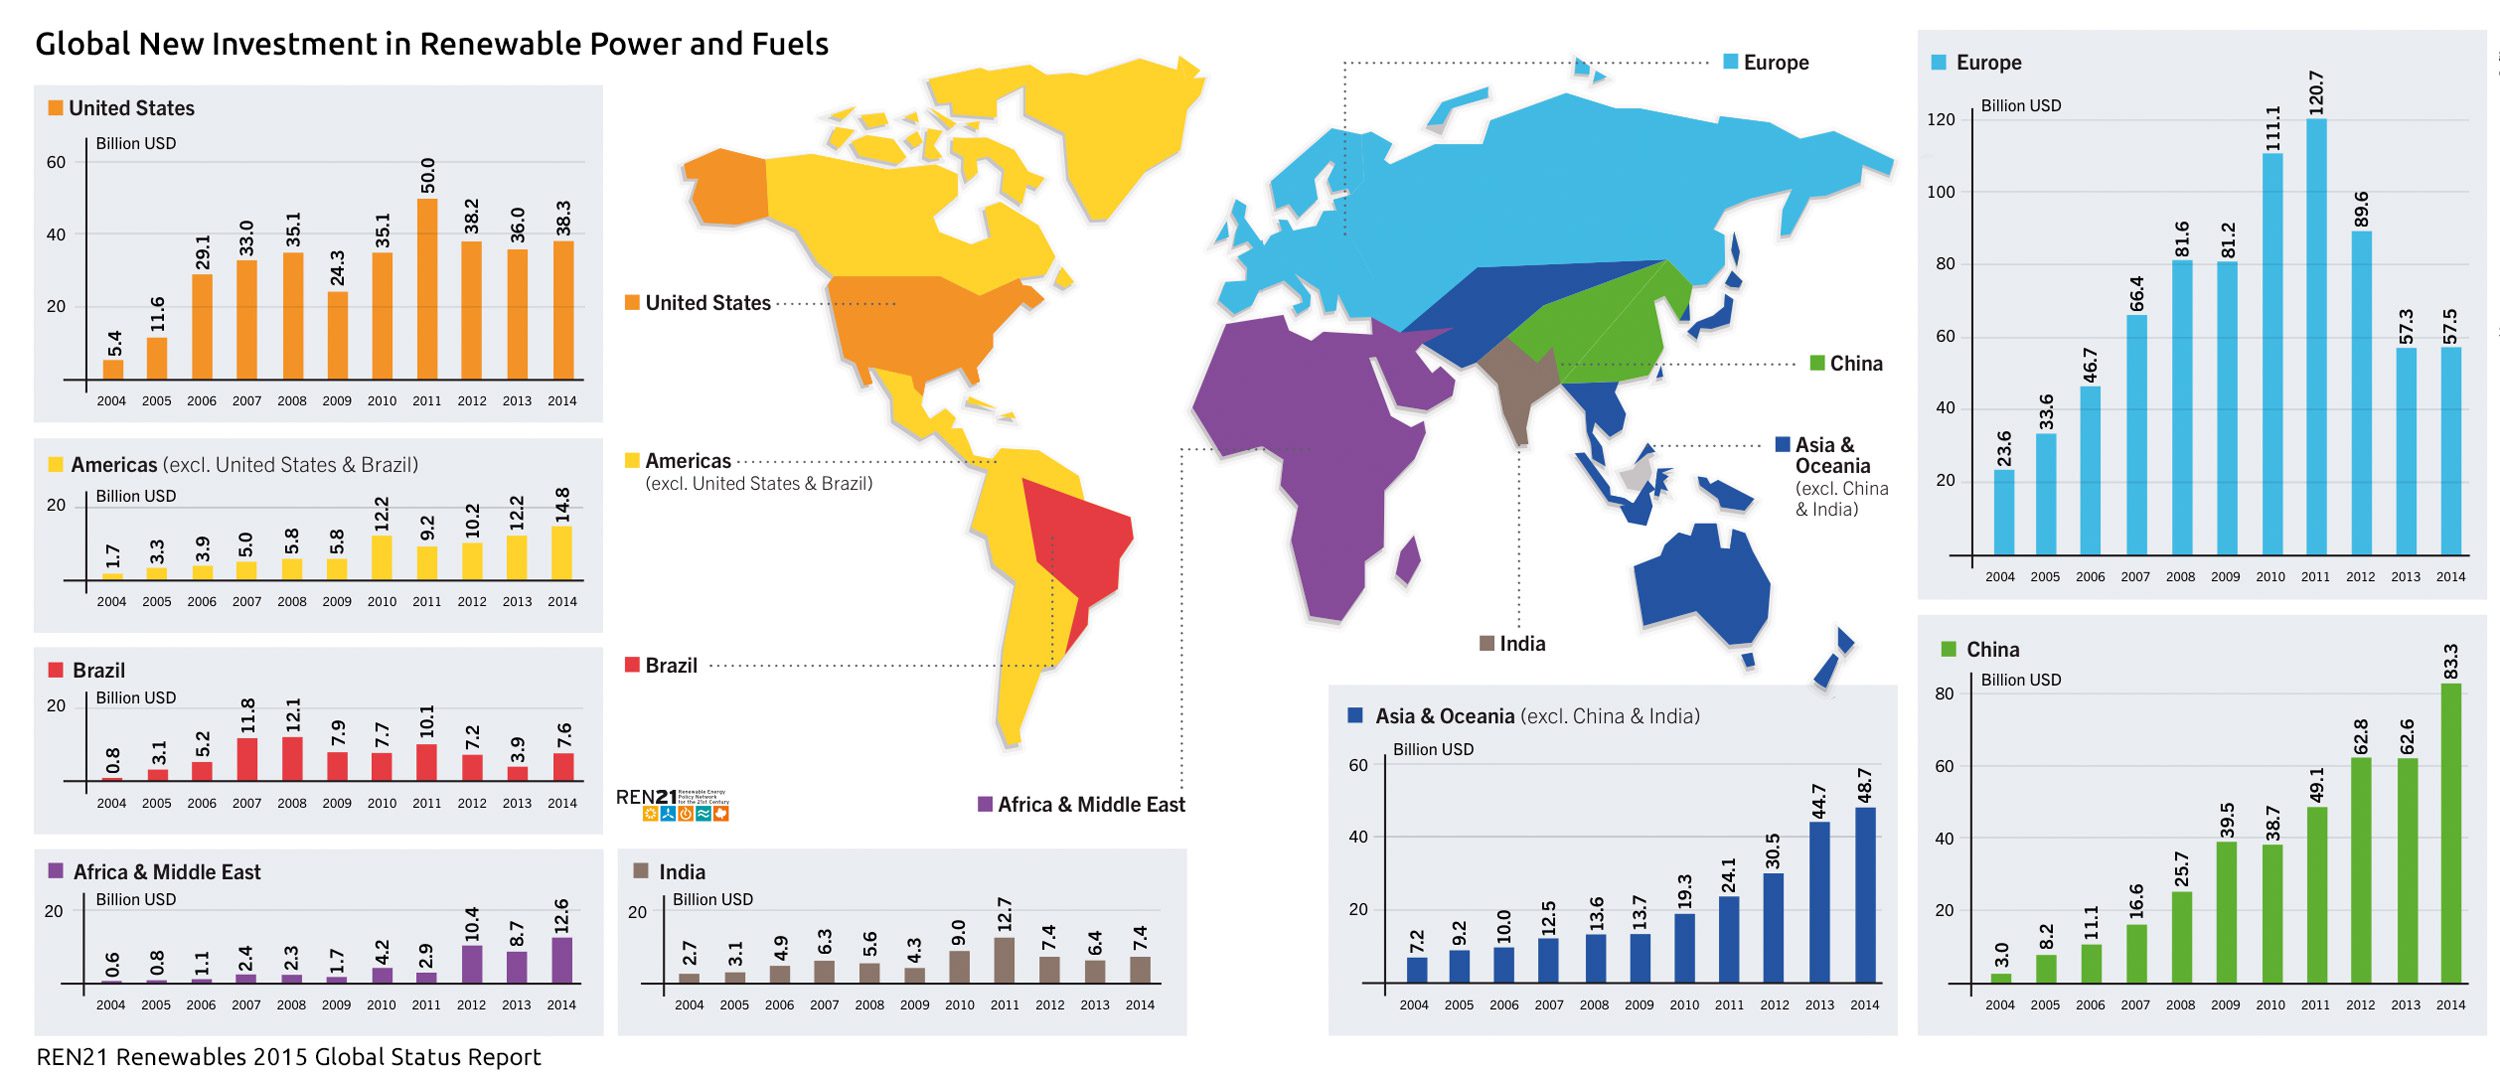
A key feature of the 2014 result was the rapid expansion of renewables into new markets in developing countries. Developed countries registered a slight increase of 3%, to $138.9 billion, but investments in developing economies noted an increase of 36%, to $131.3 billion.
In developing countries most money was invested in wind power, small-scale hydro, and geothermal power, whereas developed countries surpass them in all other technologies.
China is top of the league and accounted for USD 83.3 billion of new investment in renewable energy in 2014. The US was second at $38.3 billion. Third came Japan, at $35.7 billion.
Investment by Technology
 As in the past few years, the market in 2014 was led by record investments in solar and wind, which summed up to 92% of overall investment in renewable power and fuels. Investment in solar was again the leading sector by far and increased by 29% to $149.6 billion, while wind investment jumped 11% to a new record of $99.5 billion. That investment added 49GW of wind capacity and 46GW of solar PV.
Capital expenditure in geothermal power capacity jumped up by 23% to $2.7 billion. Other renewables saw declines: biofuels dropped 8% to $5.1 billion, biomass and waste-to-energy decreased by 10% to $8.4 billion, and small-scale hydropower went down 17% to $4.5 billion.
The top investors in wind power were China, followed distantly by the United Kingdom and Germany. China, Japan, and the United States accounted for the vast majority of new solar PV capacity.
In addition China invested in large-scale hydropower [projects larger than 50 MW], bringing a total of 22 GW of new capacity into operation during 2014.
Renewables saved 1.3 gigatonnes of CO2 in 2014
Renewables [wind, solar, biomass, waste-to-power, geothermal, small hydro and marine power] contributed to an estimated 9.1% of world electricity generation in 2014, rising up from 8.5% in 2013. Means, that last year the world electricity system emitted 1.3 gigatonnes of CO2 less than it would have if that 9.1% of electricity had been produced by fossils.
You can find additional information on general renewable energy market statistics, potentials, policies, finance, costs, benefits, innovations, education and many other topics on the web.
REN21 Interactive Map
IRENA Data and Statistics
New Energy Outlook [NEO] 2040
NEO is Bloomberg New Energy Finance’s annual long-term view of how the world’s power markets will evolve in the future. BNEF’s forecast to 2040 sees $2.2 trillion boom in small-scale solar as consumers seize control of their power, and weaker growth in electricity demand, but prospects for the climate are bleak
By 2040 renewables will command 60% of new capacity and 2/3 of power investment globally
The long-term forecast for global power is based on detailed analysis country-by-country and technology-by-technology of electricity demand, costs of generation and structural changes in the electricity system. These 5 shifts that will shake the global electricity system over the next 25 years:
- Solar everywhere. The further decline in the cost of photovoltaic technology will drive a $3.7 trillion surge in investment in solar, both large-scale and small-scale.
- Power to the people. Some $2.2 trillion of this will go on rooftop and other local PV systems, handing consumers and businesses the ability to generate their own electricity, to store it using batteries and – in parts of the developing world – to access power for the first time.
- Demand undershoots. The march of energy-efficient technologies in areas such as lighting and air conditioning will help to limit growth in global power demand to 1.8% per year, down from 3% per year in 1990-2012.
- Gas flares only briefly. Natural gas will not be the “transition fuel” to wean the world off coal. North American shale will change the gas market, but coal-to-gas switching will be mainly a US story. Many developing nations will opt for a twin-track of coal and renewables.
- Climate risk. Despite investment of $8 trillion in renewables, there will be enough legacy fossil-fuel plants and enough investment in new coal-fired capacity in developing countries to ensure global CO2 emissions rise all the way to 2029, and will still be 13% above 2014 levels in 2040.
With global electricity generation rising by 56% between 2014 and 2040 as economies develop and populations grow, global power sector emissions will increase from 13.1 gigatonnes of CO2 to a peak of 15.3Gt in 2029.
UNEP Report: Global Trends in Renewable Energy Investment 2015 [GTR] is the eighth edition of the United Nations Environment Programme [UNEP] report. Based on data from Bloomberg New Energy Finance, it has become the world’s foremost reference document on renewable energy investment.
The report, commissioned by the Frankfurt School-UNEP Collaborating Centre, can be downloaded.
Global Trends in Renewable Energy Investment 2015
GTR is a sister publication to the Renewables Global Status Report [GSR] produced by the Renewable Energy Policy Network for the 21st Century REN21. First released in 2005, REN21’s report provides a comprehensive overview of renewable energy market, industry, investment and policy developments worldwide.
Global Trends in Renewable Energy Investment 2015
Bloomberg Visual Data, Climatescope 2015: Climatescope tracks the conditions for clean energy investment on and off the grid and provides a wealth of publicly-available information.
Clean energy country competitiveness index