Trends in Global Carbon Emissions [CO₂]

In a couple of days representatives of all countries enter into negotiations for a new climate change agreement [COP 21]. At the center of the process is the question how countries can reduce enough emissions to prevent the worst impacts of climate change. According to recent data, the top 10 countries produce around 70% of global greenhouse gas emissions [GHG]. All countries must take action to mitigate climate change but ambitious actions of the world’s top emitters will likely be most effective. These numbers have to be reduced if global warming is to be limited to 2° Celsius.
Emissions by Country

In 2013, the top carbon dioxide [CO₂] emitters were China, which produced 29% of the total, followed by the US at 15%, the EU at 10% and India at 6%, the Russian Federation at 5% and Japan at almost 4% according to EDGAR database.
Emissions in China and other countries with emerging economies increased very fast in recent years. The picture is different for CO₂ emissions per capita. In 2013 Chinese citizens on average emitted about the same amount of CO₂ per capita as the average British person.
Emissions per Capita

The latest data published by the PBL shows that a record 35 billion tonnes of CO₂ from all human sources were emitted in 2013. The study also shows that China’s emissions per head of population have surpassed the EU values. The global per capita average is 5 tonnes of carbon dioxide, China is now producing 7.4 tonnes per person, to the EU’s 7.3 tonnes. The US is still far ahead on 16.6 tonnes per person. Australia is leading the list with 16.9 tonnes. This development might change the global climate negotiations where China has often used its relatively low per capita emissions to argue that it is on the same level as other developing countries.
Cumulative Emissions
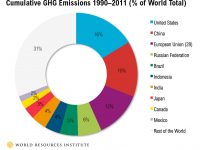
The chart shows cumulative emissions – a country’s total historic emissions – for the top 10 emitters during the period 1990 to 2011. Almost half of emissions come from just four countries: the United States, China, European Union and Russian Federation.
Emission Targets
Looking ahead, several countries have announced climate change commitments that set the stage for future activities in reducing their greenhouse gas emissions. Paris Climate Pledge Tracker
The European Union is on track towards meeting and overachieving its 2020 target for reducing greenhouse emissions by 20%, according to a report published by the European Environment Agency [EEA]. The report reveals that greenhouse gas emissions in Europe decreased by 23% between 1990 and 2014 and reached the lowest levels on record.
Carbon Dioxide Emissions 2013
This is a list of states by annual CO₂ emissions based on the EDGAR database created by European Commission and Netherlands Environmental Assessment Agency [PBL] released in 2013. The following table lists the carbon dioxide emissions in thousands of CO₂ tonnes along with a list of emissions per capita in tonnes of CO₂ per year from same source. The data only considers CO₂ emissions from the burning of fossil fuels and cement manufacture, but not emissions from land use, land-use change, forestry and international shipping.
| CO₂ emissions in kt | Share of global emissions | CO₂ per capita in t | Ranking CO₂ per capita | |
|---|---|---|---|---|
| World | 35,270,000 | – | ||
| China | 10,330,000 | 29.3 % | 7.4 | 11 |
| US | 5,300,000 | 15.0 % | 16.6 | 2 |
| EU | 3,740,000 | 10.6 % | 7.3 | 12 |
| India | 2,070,000 | 5.9 % | 1.7 | 20 |
| Russia | 1,800,000 | 5.1 % | 12.6 | 6 |
| Japan | 1,360,000 | 3.9 % | 10.7 | 7 |
| Germany | 840,000 | 2.4 % | 10.2 | 8 |
| South Korea | 630,000 | 1.8 % | 12.7 | 5 |
| Canada | 550,000 | 1.6 % | 15.7 | 4 |
| Indonesia | 510,000 | 1.4 % | 2.6 | 18 |
| Saudi Arabia | 490,000 | 1.4 % | 16.6 | 3 |
| Brazil | 480,000 | 1.4 % | 2.4 | 10 |
| UK | 480,000 | 1.4 % | 7.5 | 19 |
| Mexico | 470,000 | 1.3 % | 3.9 | 17 |
| Iran | 410,000 | 1.2 % | 5.3 | 16 |
| Australia | 390,000 | 1.1 % | 16.9 | 1 |
| Italy | 390,000 | 1.1 % | 6.4 | 13 |
| France | 370,000 | 1.0 % | 5.7 | 15 |
| South Africa | 330,000 | 0.9 % | 6.2 | 14 |
| Poland | 320,000 | 0.9 % | 8.5 | 9 |